Collision Avoidance Scenarios with Multi-Sensor Fusion in CARLA
- Raffay Hassan
- Feb 16
- 3 min read

Updated: 6 days ago
Phase: 1 (Scenario Baseline)
Focus: Lane following + radar/LiDAR fusion + TTC + emergency braking + avoidance manoeuvre
Overview
This blog documents the Phase 1 scenario implementation of an autonomous collision avoidance pipeline in CARLA. The focus was to create repeatable scenarios, apply multi-sensor fusion, and validate safety behaviours (emergency braking and post-stop manoeuvres) under both normal and adverse weather conditions.
Scenario Design (Town04)
Town04 was selected due to its long and consistent road segments suitable for controlled approach tests.
In both scenarios:
Ego vehicle is spawned and verified to have clear forward motion
A stationary obstacle vehicle is spawned ~80m ahead
Obstacle placement uses lane-aligned waypoints to ensure realism
Simulation runs in synchronous mode with fixed timestep for repeatability

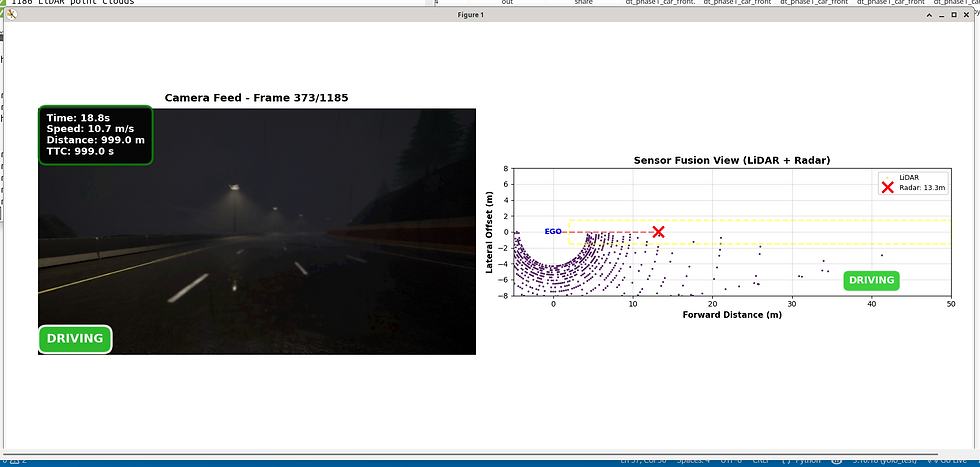
Sensor Configuration in Simulation
Three simulated sensors are used:
RGB camera (frame capture)
LiDAR (forward corridor minimum distance extraction)
Radar (frontal detections with depth and velocity)
All streams are logged continuously for analysis.
Sensor Fusion and Association Gating
To reduce false positives, a gated fusion method is used:
Candidate readings are accepted only when consistent with expected obstacle distance within a fixed tolerance
Fused distance is computed from valid candidates
If no valid candidate exists, the system treats the obstacle as “not confirmed” (sentinel distance)
This prevents spurious radar/LiDAR returns from triggering braking incorrectly.
TTC Computation
TTC is computed only when fused distance is valid:
TTC=distance / RelativeVelocity.
A TTC threshold provides a second trigger layer alongside absolute distance thresholds.
Scenario 1 Clear Conditions
Goal
Validate baseline behaviour:
Normal driving → approach obstacle
Pre-emptive avoidance when detected early
Emergency brake if too close
Structured lane-change recovery after stopping
Resume stable driving after passing obstacle


Scenario 2 Extreme Rain Conditions
Goal
Test robustness under reduced visibility and wet-road conditions by applying extreme rain parameters:
maximum precipitation and wetness
fog introduced at limited distance
low sun altitude for darker lighting
The scenario then repeats the same approach, braking, and recovery behaviour.


Safety Logic and Actions
Safety levels are derived from fused distance and TTC:
SAFE → continue lane-following
WARNING → pre-emptive avoidance steering
CRITICAL → emergency braking
POST-STOP → lane change and recovery sequence
RESUME → return to normal lane-following
Vehicle state logs record which action is active and why.
Data Logging Outputs
Each scenario produces:
radar_data.csv
lidar_data.csv
vehicle_state.csv
sensor_fusion.csv
LiDAR point clouds (.ply)
Camera frames (.jpg)
Output video (output.mp4)
These files provide reproducible evidence for evaluation and reporting.

Sensor Distances Over Time
This graph compares:
Radar distance
LiDAR distance
Fused distance (final decision distance)
Brake and Avoid thresholds
What it shows:
Radar measurements fluctuate slightly around 12–14m.
LiDAR readings remain very stable (4.3m when obstacle is close).
The fused distance follows the safest, validated measurement.
When the fused distance drops below the brake threshold (8m), the system transitions to CRITICAL.
This confirms that:
The gating logic successfully filters inconsistent measurements and relies on validated sensor data.
Time-to-Collision (TTC)
This graph shows TTC over time with a critical threshold at 2 seconds.
Key observations:
TTC spikes when the vehicle is far from the obstacle.
As the vehicle approaches, TTC drops sharply.
Once TTC < 2s → system enters emergency braking mode.
This proves:
TTC-based safety logic correctly predicts collision risk before impact.
Safety Level Distribution
The bar chart shows the proportion of time spent in:
SAFE
WARNING
CRITICAL
From your data:
SAFE dominates
Only a small percentage enters CRITICAL
This demonstrates:
The system operates safely for most of the scenario, only triggering braking when genuinely required.
Radar–LiDAR Agreement
This histogram shows the difference:
Radar Distance – LiDAR Distance
Mean difference = 8–9m.
Interpretation:
Radar tends to measure longer distances.
LiDAR detects more precise obstacle boundaries.
Fusion gating prevents incorrect large deviations.
This validates:
Multi-sensor fusion reduces reliance on any single noisy sensor.
TTC Distribution
Most TTC values are above 2 seconds (safe zone).
Only a small cluster falls below 2 seconds → emergency braking region.
This confirms:
The braking trigger is rare and event-based, not random.
Safety Pie Chart
From results:
SAFE =89%
CRITICAL = 8%
WARNING = 2–3%
This clearly demonstrates:
The autonomous controller remains stable and controlled even during obstacle interaction.
Outcome
Phase 1 scenario testing demonstrates:
repeatable obstacle placement and approach behaviour
stable lane-following control
gated fusion strategy to reduce false triggers
TTC-enhanced emergency braking
controlled recovery manoeuvre after stopping
comparison-ready runs under clear and extreme rain conditions
This establishes a simulation baseline suitable for systematic evaluation and later extension.
Github : https://github.com/rh960/Sensor_Driven_Digital_Twin_For_Collison_Prevention_in_Autonomous_Systems


Comments